
Fleet summary
In this article
The fleet summary is a panel that shows you how the fleet is doing right now and what it did in the period you choose.
Before you start
- You only see the units you have access to.
- The Activity and Top devices figures are part of reports. If your role does not include reports, you see the fleet's state and what needs attention, but not those figures.
- Distances and speeds use the units you chose in My account › Units.
Open it
- On the web, open Fleet summary in the map's sidebar. On a narrow screen it is under More.
- On your phone, open the Reports tab, keep Entire fleet chosen and tap the Fleet summary figures. That tab only shows up if your role includes reports.
Right now
Here you see each unit's state at this moment, whatever period you chose.
- Moving is a connected unit that is on the move.
- Stopped is a connected unit that is standing still.
- No signal is a unit that stopped reporting without closing the connection.
- Disconnected is a unit that closed the connection or has not connected yet.
- Disabled is a unit disabled on the platform. This state only shows up if there is one.
On the web this count is in the map's sidebar (on a narrow screen, inside the summary), and tapping a state filters the device list. On your phone, the ring shows the Online percentage (moving plus stopped).
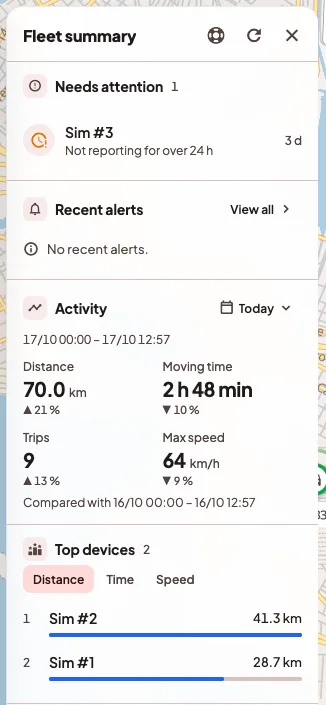
Needs attention
- Not reporting for over 24 h gathers the units that have gone more than a day without reporting and the ones that have not reported yet, which show Never. The ones that have not reported yet come first, then the rest from the oldest to the most recent. Disabled units and units connected right now are left out.
- Incomplete telemetry gathers the units whose last position arrived without some of these three data, which are motion or speed, battery and distance. The Score …/… counts how many of the three arrive. If a unit is already on the "not reporting" list, it is not repeated here.
When there is nothing pending, you see All devices are reporting. Tapping a row shows the unit on the map. Each list shows 5 units, and the rest shows as +… more.
Recent alerts
This shows the 5 most recent alerts. View all opens the full list.
Activity
Under Period you can choose Today, Yesterday, 7 days or 30 days. Days follow your time zone. Today goes from 00:00 until now, and 7 days and 30 days include today until now.
- Distance is the sum of the period's trips.
- Moving time is how long those trips lasted, added up.
- Trips is how many trips there were.
- Max speed is the highest speed of all the trips.
The figures come from the same trips as the Trips report, so they match it. A 0 km "trip" adds to none of them.
Each figure is compared with the same stretch of the previous period. For example, Today until 10:00 is compared with yesterday until 10:00. Below it says which dates it compares with (Compared with … – …). If the previous period was zero, no percentage is shown.
Top devices
Here you see the units that stood out in the period, up to 8, ranked by Distance, Time or maximum Speed. Units that did not move are left out, and if none moved, it says There were no trips in this period.
On your phone
The phone screen brings the same, arranged differently.
- Right now with the Online ring and the count per state.
- Activity with Distance, Avg speed, Units with distance and Moving time. Avg speed is the distance divided by the moving time. Units with distance counts the ones that covered any distance.
- Four lists, which are Top distance in period, Top moving time, Top average speed and Top max speed.
- Not reporting for over 24 h, with the first 5.
- Sensor/telemetry health by device, with up to 12 units, from worst to best. A unit is Healthy when the three data arrive, the battery is at 20% or more and the cell signal is not weak. It is Partial if at least one arrives, and Low if none does.
If something goes wrong
- "Could not load period metrics." or "We couldn't load the period totals. You can check your connection or change the range and try again." The figures did not arrive. You can ask for them again with Retry.
- "Period metrics are part of reports, and your role does not include them. If you need them, an administrator of your organization can give you access." Your role does not include reports, so you don't see Activity or Top devices. The rest of the panel keeps working.
- "Could not load the fleet." We could not load the state of the units. The Activity figures load separately, so they may still show.
- The distance does not match the unit's odometer. That is expected, because the summary adds up the period's trips and the odometer is a different figure.